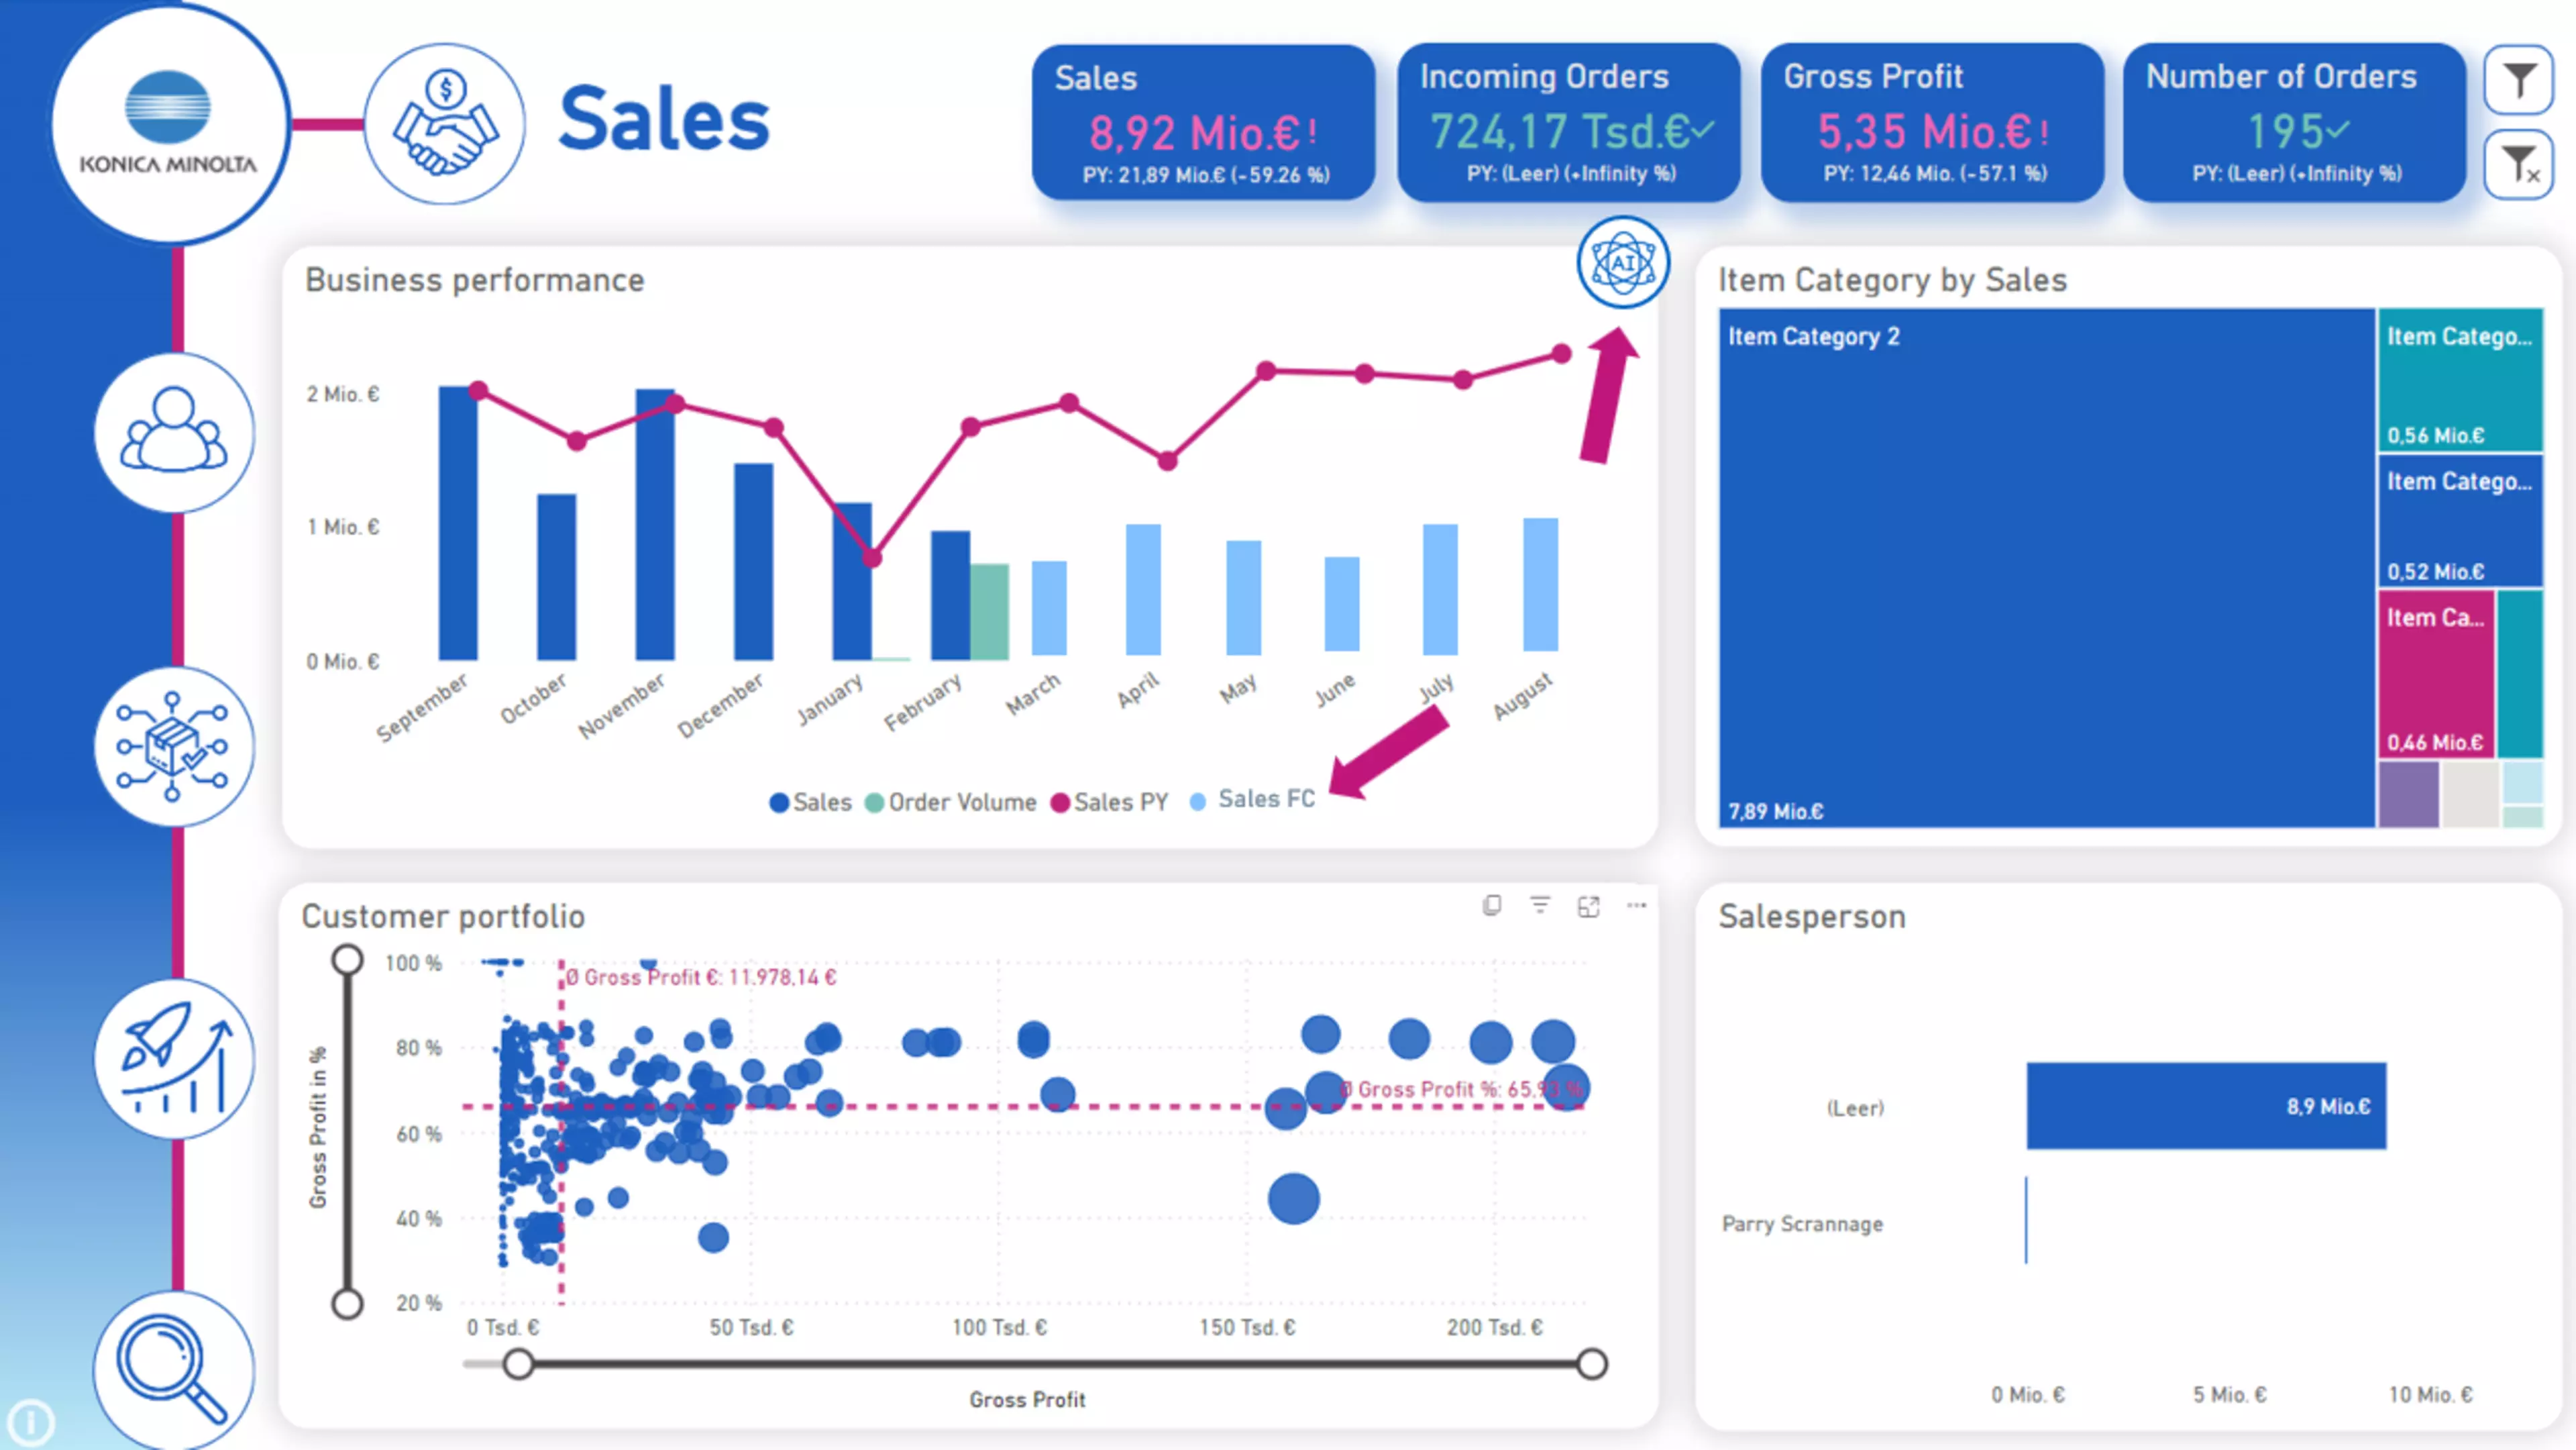
Medium-sized companies have to shell out a lot of money if they want to add reliable, AI-supported forecasting functions to their business intelligence systems. It would be appealing to look into the future: not just predicting turnover for the next month (this is usually not difficult, you mainly have to look at the order backlog), but for the next 12 months. The problem is that you need data scientists for this and they are currently among the most sought-after - and therefore most expensive - specialists of all.

Sophisticated AI model in just one week

This is why the technology and managed service provider Konica Minolta had its own team of data scientists develop an AI model that enables forecasts “out of the box”. “This naturally raises the question: don't such models always have to be tailored to the individual company?” says Markus Bauten, Manager Business Solutions at Konica Minolta. And gives the answer himself: “Yes, actually they do. But our model already delivers around 80 percent in the standard version. We only have to take care of the remaining 20 percent on site at the customer's premises, in particular training the model with the company's data. This is done within a week.” It is obvious that this approach is much cheaper than a conventional, lengthy consulting project.

Dashboards become a forecasting tool

Konica Minolta customers usually use an ERP system such as Microsoft Dynamics 365 Business Central, Microsoft Dynamics NAV, Infor LN or others. They therefore have a lot of (historical) data at their disposal, which is clearly displayed thanks to Konica Minolta's dashboards - a helpful look into the past and the present. What is new, however, is the view into the future. One example of this is churn prediction. Says Bauten: “We have developed a model with around 15 variables that indicates with a high degree of reliability the probability of a customer leaving the company in the next year.” The variables include, for example, changes in purchase frequency or the average invoice amount.

This model simply needs to be trained on site with the company's data. ‘If I only founded my company yesterday, then of course it won't work,’ explains Bauten. ‘Customers must have already been lost in the past for the model to be able to learn from this.’ The reliability of the forecast is over 90 per cent. ‘That's an alarmingly high level of accuracy,’ says Bauten. And the sales and marketing team then knows that it should take targeted measures with certain customers to ensure that they remain with the company.

KI Forecast Dashboard Konica Minolta
Markus Bauten Konica Minolta
Markus Bauten

Manager Business Solutions

"Some controllers spend half their time calculating sales forecasts. With our model, this can be completely automated."

Sales forecast at the touch of a button

Forecasting sales is even more challenging. ‘Here, we not only take into account internal data such as sales trends for individual products, but also external data, for example on the economy, interest rates and the like - depending on the industry in question,’ explains Bauten. "Some controllers spend half their time calculating such forecasts. With our model, this can be completely automated." This means you can start implementing measures on the first of the month instead of calculating forecasts. ‘This tool is particularly complex, but also particularly popular,’ says Bauten. "The main advantage is the labour saving. In addition, it is also around 10 per cent more accurate on average than manual calculations, as more data can be taken into account." The average error for a 10-month forecast is just 4 per cent.

From ABC segments to behavioural clusters

AI also helps to better understand your own customers. Many traditional sales teams use an ABC analysis: A customers make up 80 per cent of sales, B customers 15 per cent and C customers around 5 per cent. ‘The problem is, of course, that there can be very different needs and behaviours within the A customers,’ says Bauten. ‘That's why this categorisation doesn't help with the sales approach.’

AI offers the solution here too: it calculates clusters of customers who exhibit similar behaviour based on around 20 key figures. These clusters are not predetermined, but the AI recognises patterns and suggests groups of customers on this basis - which therefore look different for every company. ‘You can't actually calculate this manually,’ says Bauten. ‘That exceeds the human ability to analyse.’ One example of a cluster would be bargain hunters. "I know that I can appeal to them with a discount offer, for example. For others, I might need to offer an additional service," says the expert. ‘The cluster analysis therefore makes it possible to target each customer group in a way that suits them.’

Video demo: AI-supported sales dashboards

How does a sales dashboard with integrated AI forecasts really work? Find out in our video!

Power BI Dashboard Sales
From what company size are AI-supported dashboards suitable?

The target group for Konica Minolta's innovative dashboard product is medium-sized companies with a turnover of around 10 million euros or more.

How reliable are the AI dashboard's forecasts?

The accuracy of the churn prediction is 90 per cent. The accuracy of the sales forecast is around 99 per cent in the first four months and still 96 per cent after 10 months. Markus Bauten's team generally aims for an accuracy of over 90 per cent. The results also depend on the quality of the data, which we are happy to improve together with our customers.

How long does it take to implement the AI dashboard?

The experts at Konica Minolta currently need around two weeks to customise the AI model to the individual company and make all dashboard functions available. The aim is to reduce this period further to one week.

Insights BI - Get instant clarity on a wide range of data in your company

You have a lot of data in your company - sales, costs, stock levels, invoice data and much more. For data analyses and reporting on these figures, you probably use huge Excel files that you have to fill in and maintain manually. How time-consuming and error-prone!

Konica Minolta has developed out-of-the-box dashboards for you on various topics, which you can use to display this data at the touch of a button. With our Insights BI service - based on Power BI - you get instant access to consolidated data, interactive dashboards and real-time analyses - 80% are ready to go, so you can get started right away - the rest we customise for you. Focus on the essentials and say goodbye to manually collecting data and creating reports.

Sales AI - The intelligent sales assistant for a target group-specific customer approach

Knowing your customers inside out, predicting their behaviour, will they buy more or less, or even change supplier? How valuable this information would be for you if you could then decide what measures you need to take to persuade customers to buy with even more specific measures or even prevent them from switching.

Konica Minolta has developed an AI-based forecasting tool that allows you to see predictions and behaviours at the touch of a button. Optimise your sales strategy with our Sales AI service, which delivers accurate sales, demand and customer churn forecasts precisely and quickly thanks to intelligent automation and clusters customers according to their buying behaviour. Achieve your sales targets faster through data-driven decisions and personalised, target group-specific customer targeting.

BI + AI: a transparent future

Dashboards become a forecasting tool: Find out more, get a trial version or arrange a non-binding consultation!

To the AI dashboards (Link zu Sales AI)

KI Forecast Dashboard Konica Minolta
Dominik Baum, Konica Minolta

Get started now

Learn more about the Business Transformation Suite or schedule a free demo - and experience how our integrated, modular platform helps you turn your data into informed decisions.

Dominik Baum
Customer Success Manager
Share:

Rate this article